Observations
Safety culture, measured.
Capture positive and at-risk observations from the field in seconds. See trends by site, crew and supervisor. Turn frontline behaviour into leading indicators your board can actually read.
The old way
You count incidents. By then it's already happened.
Lag indicators tell you about last quarter's failures. The near-miss nobody logged, the shortcut everyone takes at 4pm on Friday: that is where the next incident lives, and no incident register will show it to you.
How it works
From the field to the boardroom.
Anyone logs an observation in under 30 seconds
Photo, voice or text, positive or at-risk.
AI classifies and clusters
Same hazard, same location, same time of day, patterns surface themselves.
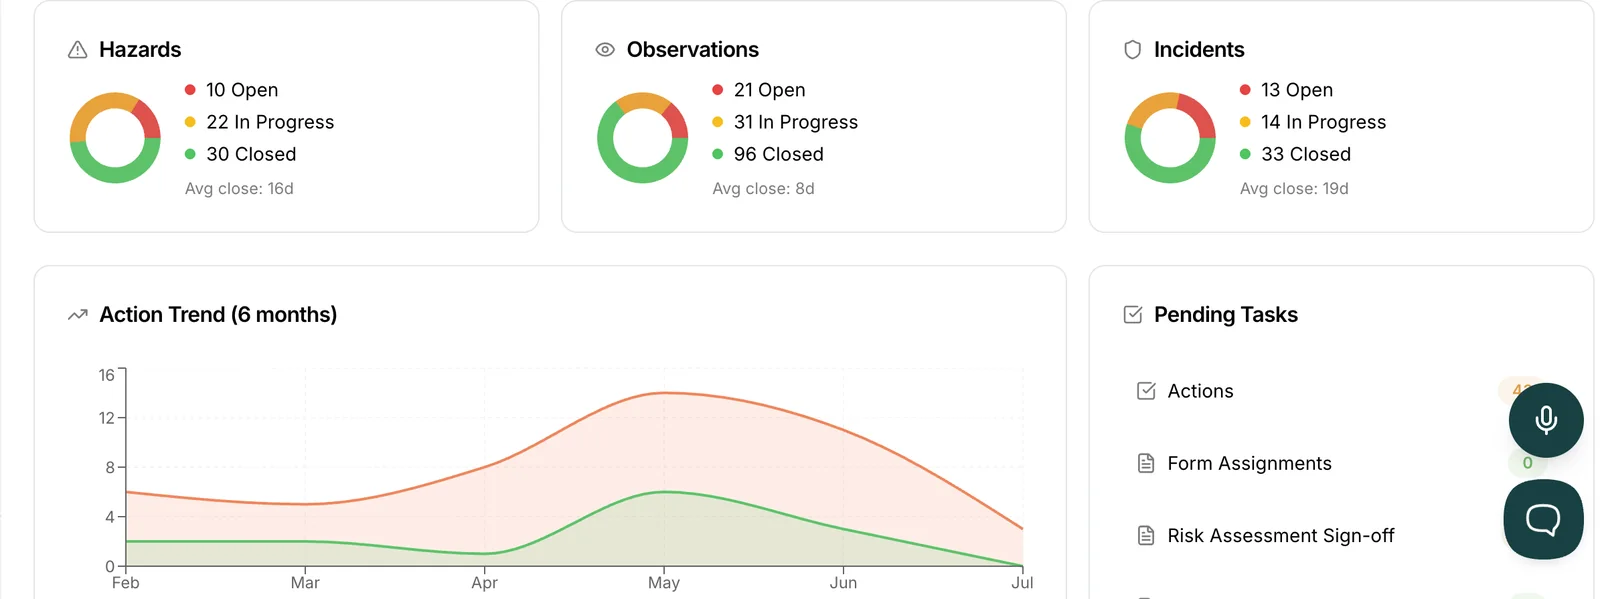
Trends land on the dashboard
By site, crew, supervisor and hazard type, week over week.
Leading vs lagging, in one breath.
Lagging indicators count what went wrong. Leading indicators count what you are doing about it before it does. Observations are the cheapest leading indicator there is: your crew already sees the risks, SiteSherpa just gives them somewhere to put them.
Common questions
Will crews actually use it?
Thirty seconds, phone, voice, no login maze. Uptake lives or dies on friction, so we removed it.